

 Back
to listing
Back
to listing
15 Essential MIS Reports in Higher Education Every Registrar and Director Should Review
MIS Reports in Higher Education: 15 Reports Every Registrar and Director Should Review
Introduction
Most colleges and universities are not short on data. Admissions forms, attendance registers, fee ledgers, examination mark sheets, placement records — the raw material exists in abundance, spread across ERPs, spreadsheets, biometric devices, and departmental files. What’s often missing is not data, but usable information: numbers organised into a form that a registrar, dean, or director can look at and immediately understand what needs attention.
This is the gap that MIS (Management Information System) reporting is meant to close. Yet in many institutions, “MIS” is treated as one all-purpose spreadsheet updated once a month for a management review meeting — long after the moment for course correction has passed.
This article lays out 15 MIS reports for colleges and universities, who should be responsible for each one, how often it should be reviewed, and the decision it is meant to support. Rather than treating institutional data reporting as a once-a-year compliance exercise, the aim here is a practical checklist that registrars, IQAC coordinators, deans, and directors can hold up against their own institution’s reporting today.
What is an MIS report in higher education?
A management information system in higher education is the structured reporting layer that sits between raw operational data and institutional decision-making. Within that system, an individual MIS report is a recurring summary — built from underlying operational records — designed to support one specific decision. It differs from a raw data dump: an MIS report has a defined owner, a fixed frequency, a consistent format, and a clear audience.
For example, raw attendance data is simply a record of who was present in which class on which day. An attendance exception report takes that same data and surfaces only the students who have crossed a risk threshold — say, below 75% attendance in the last two weeks — so a mentor or HOD can act without scanning thousands of rows.
Good MIS reports for universities and colleges typically span five broad areas: academics, administration, finance, student life, and compliance. Each of the 15 reports below sits in one of these areas.
MIS report vs dashboard vs operational report
These three terms are often used interchangeably, but they serve different purposes:
- Operational report — a transaction-level record used for day-to-day work, such as a single class’s attendance sheet or one student’s fee receipt. It answers “what happened right now, for this one case.”
- MIS report — a structured, recurring summary built for a specific decision-maker, such as a weekly fee-outstanding report for the accounts office or a monthly faculty workload report for academic leadership. It answers “what is the pattern, and does it need action.”
- Education MIS dashboard — a live, visual, usually interactive view of one or more MIS reports, refreshed continuously and used for ongoing monitoring rather than a single decision point.
Institutions often have plenty of operational data and, increasingly, an education MIS dashboard or two — but the middle layer, the MIS report that turns operational data into a decision-ready summary, is frequently missing or informal.
Why leadership needs structured institutional reporting
Three things tend to go wrong when MIS reporting is absent or ad hoc:
- Decisions get delayed. A fee shortfall that could have been flagged in week two of the semester only becomes visible at the finance committee meeting in week ten.
- Decisions get made on incomplete information. A department head allocates teaching load based on memory rather than a workload report, inadvertently overloading two faculty members while under-utilising others.
- Different departments tell different stories. Without a single source of truth, the admissions office, accounts office, and academic office may each report a different enrolment figure for the same class — and nobody is sure which is correct going into an accreditation visit.
This is precisely where higher education analytics earns its place: not as a buzzword, but as the discipline of turning scattered records into structured, comparable, trustworthy numbers. Structured MIS reporting doesn’t eliminate judgment — it ensures judgment is applied to accurate, timely, and complete information rather than whatever numbers happen to be at hand.
The 15 essential MIS reports
The reports below are grouped loosely by function, but every institution’s mix of college management reports will look slightly different depending on size, affiliation requirements, and residential facilities. Each entry follows the same structure — what it includes, who owns it, how often it should be reviewed, and the decision it supports — so the list can double as a quick-reference table for your own institution.
1. Admissions and enrollment report
What it includes: Applications received, offers made, admissions confirmed, and seats filled against sanctioned intake, broken down by programme, category, and quota. Data owner: Admissions office Review frequency: Weekly during the admissions cycle Decisions supported: Intake planning and correcting shortfalls before the cycle closes, rather than after it.
2. Student demographic report
What it includes: Enrolled students by gender, category, region, and first-generation-learner status, alongside other parameters required for scholarship administration and equity monitoring. Data owner: Admissions office or Registrar’s office Review frequency: Annually, or aligned to the accreditation cycle Decisions supported: Scholarship allocation, equity monitoring, and accreditation submissions.
3. Attendance exception report
What it includes: Only the students who have fallen below the minimum attendance threshold, rather than a full attendance ledger. Data owner: Academic office Review frequency: Daily or weekly Decisions supported: Early mentoring and intervention before a student becomes ineligible to sit examinations.
4. Fee collection and outstanding dues report
What it includes: Fees collected, fees pending, and defaulters, segmented by programme, batch, or category. Data owner: Accounts or finance office Review frequency: Weekly Decisions supported: Collection follow-ups and cash-flow planning, instead of discovering a shortfall at semester-end.
5. Course-registration report
What it includes: Student registrations against each course or elective, most relevant for institutions running choice-based credit systems. Data owner: Academic office or examination cell Review frequency: At the start of each semester Decisions supported: Faculty, classroom, and time-slot allocation before teaching begins.
6. Faculty workload report
What it includes: Teaching hours, administrative responsibilities, and other duties assigned to each faculty member. Data owner: Academic leadership or HOD Review frequency: Monthly Decisions supported: Balancing load, planning recruitment, and avoiding over-reliance on a small group of staff.
7. Timetable utilisation report
What it includes: How efficiently classrooms, labs, and faculty time slots are being used across the week. Data owner: Academic office Review frequency: Monthly Decisions supported: Planning additional sections, resolving clashes, and building the case for added infrastructure.
8. Examination-performance report
What it includes: Pass percentage, grade distribution, and subject-wise performance after each assessment cycle. Data owner: Examination cell Review frequency: Each assessment cycle Decisions supported: Identifying subjects or cohorts that need remedial academic support.
9. Backlog and student-progression report
What it includes: Students carrying backlogs, number of attempts, and whether they remain on track to progress to the next year. Data owner: Academic office or examination cell Review frequency: Each semester Decisions supported: Identifying students at risk of not completing their programme on time.
10. Withdrawal and retention report
What it includes: Students who withdrew, transferred out, or discontinued, along with stated or inferred reasons. Data owner: Registrar’s office Review frequency: Semester-wise or annually Decisions supported: Understanding whether attrition is concentrated in a particular programme, batch, or demographic, and shaping retention strategy.
11. Placement and higher-studies report
What it includes: Eligible students placed, average and highest packages, offers per student, and students pursuing higher studies. Data owner: Placement cell Review frequency: Monthly or semester-wise Decisions supported: Ongoing training-and-placement strategy, not just an end-of-year brochure figure.
12. Research and publication report
What it includes: Faculty publications, patents, funded projects, and citations, consolidated per department. Data owner: IQAC or research cell Review frequency: Annually Decisions supported: Research strategy and accreditation or ranking submissions.
13. Hostel and transport report
What it includes: Hostel occupancy, vacancy, maintenance requests, and transport route utilisation. Data owner: Hostel or transport office Review frequency: Monthly Decisions supported: Facility planning, cost control, and safety oversight.
14. Accreditation-evidence report
What it includes: The data points accreditation bodies typically request — faculty-student ratio, infrastructure utilisation, research output, student outcomes. Data owner: IQAC Review frequency: Maintained continuously, reviewed each accreditation cycle Decisions supported: Accreditation readiness without reconstructing evidence under deadline pressure.
15. Management exception report
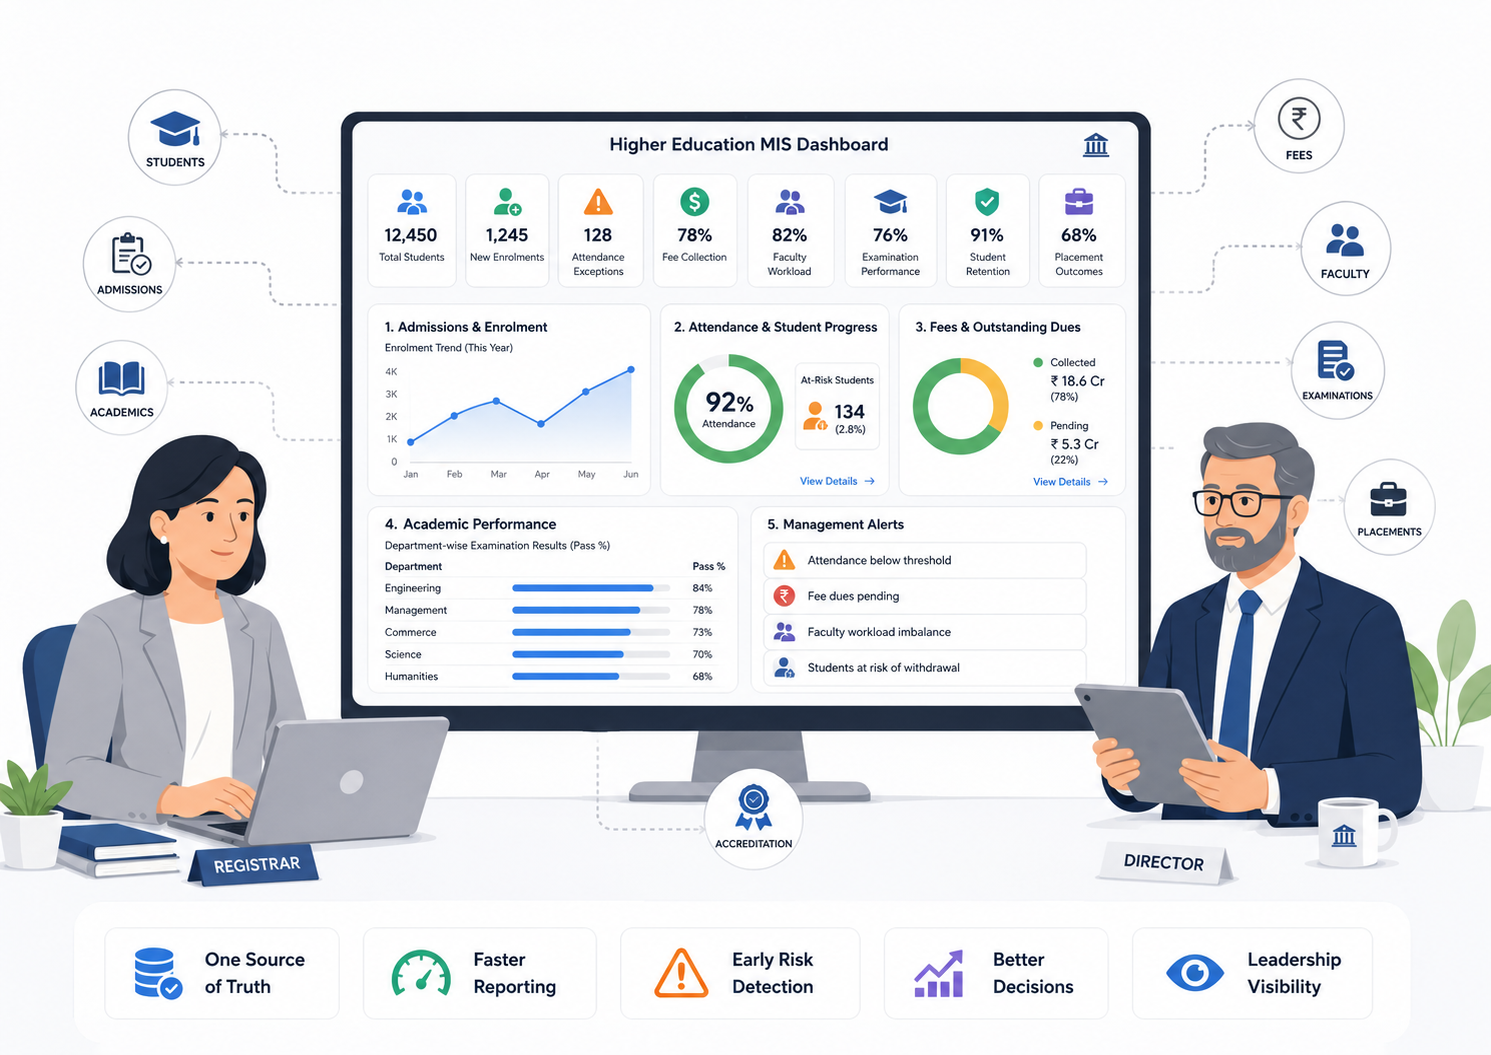
What it includes: A rolled-up view that surfaces only the items across all other reports that require attention — an under-enrolled programme, a department over its fee-default threshold, a batch with unusually high backlogs. Data owner: Registrar’s or director’s office Review frequency: Weekly Decisions supported: Leadership oversight and cross-institutional action, without reading all fourteen reports underneath it.
Key takeaway: Leadership doesn’t need hundreds of reports — it needs a well-defined, well-owned set of college management reports, each reviewed on the right cadence and built to surface exceptions rather than raw data.
Daily, weekly, monthly, semester-wise, and annual reports
Not every report needs the same cadence. A useful way to think about frequency:
- Daily or weekly — attendance exceptions, fee collection, hostel occupancy, management exceptions: anything where a delay of a few days changes the outcome.
- Monthly — faculty workload, timetable utilisation, placement progress: operational reports that shift gradually and are reviewed as part of a regular cycle.
- Assessment or semester-wise — examination performance, course registration, backlog and progression, withdrawal and retention: tied naturally to the academic calendar rather than the clock.
- Annual or accreditation-cycle — demographic report, research output, accreditation-evidence report: reports that inform long-term planning and external submissions rather than immediate action.
Reviewing every report daily creates fatigue; reviewing every report annually creates blind spots. Matching frequency to how quickly a report’s underlying data changes — and how costly a delay would be — is the more sustainable approach.
Who should own each report?
Every MIS report needs a named owner — the person responsible for the data being accurate and the report being produced on schedule, not just a reader. The table below consolidates ownership, frequency, and the decision supported for all 15 reports, so it can be used directly as an internal reference.
| MIS report | Data owner | Review frequency | Decision supported |
| Admissions and enrollment report | Admissions office | Weekly during admissions cycle | Intake planning |
| Student demographic report | Admissions / Registrar’s office | Annually or per accreditation cycle | Scholarship and equity planning |
| Attendance exceptions | Academic office | Daily or weekly | Student intervention |
| Fee outstanding report | Accounts | Weekly | Collection planning |
| Course-registration report | Academic office / exam cell | Start of each semester | Faculty and room allocation |
| Faculty workload | Academic leadership | Monthly | Resource allocation |
| Timetable utilisation | Academic office | Monthly | Scheduling and infrastructure planning |
| Examination performance | Examination cell | Assessment cycle | Academic improvement |
| Backlog and progression | Academic office / exam cell | Each semester | At-risk student identification |
| Withdrawal and retention | Registrar’s office | Semester-wise or annually | Retention strategy |
| Placement outcomes | Placement cell | Monthly or semester-wise | Employability planning |
| Research and publication | IQAC / research cell | Annually | Research strategy, accreditation |
| Hostel and transport | Hostel / transport office | Monthly | Facility planning |
| Accreditation-evidence report | IQAC | Continuous, reviewed each cycle | Accreditation readiness |
| Management exception report | Registrar / director’s office | Weekly | Leadership oversight |
Without a named owner, reports drift: nobody notices when the data goes stale, and the report quietly stops being trustworthy long before anyone stops circulating it.
Common MIS-reporting mistakes
A few patterns show up repeatedly in institutions trying to formalise MIS reporting:
- One giant spreadsheet instead of purpose-built reports. A single master file with dozens of tabs looks comprehensive but is unusable in a meeting — nobody can find the one number they need quickly.
- No agreed definitions. “Enrolled students” might mean different things to admissions, accounts, and academics if there’s no shared definition of when a student counts as enrolled.
- Manual consolidation. When reports are built by copying numbers from multiple registers into Excel, errors creep in, and the report is often a week or two out of date by the time it’s reviewed.
- Reports built for compliance, not decisions. Some reports exist only because an accreditation body asks for them once a year, and nobody looks at them the rest of the time — a missed opportunity, since the same data could support ongoing decisions.
- No exception logic. A report listing every student’s attendance is technically complete but practically unusable; the value
How institutions can create one reliable source of truth
The recurring theme across these mistakes is fragmentation — data living in separate systems (or separate spreadsheets) maintained by separate offices, each with its own version of the truth. Three practical steps help:
- Consolidate source data. Admissions, attendance, fees, examinations, and placements should draw from one underlying system, or at minimum from systems that sync with each other, rather than parallel manual records.
- Standardise definitions before automating reports. Agree, in writing, what counts as “enrolled,” “at risk,” “placed,” or “on time” before building the report — otherwise automation just makes an inconsistent number faster to produce.
- Automate the recurring reports, not the one-off ones. The 15 reports above are recurring by nature; they are the highest-value candidates for automation, since manual reconstruction each cycle is where errors and delays accumulate.
Institutions that get this right tend to treat institutional data reporting as infrastructure, not as a monthly favour one office does for another — which is what makes higher education analytics genuinely usable rather than a static PDF nobody revisits.
Where EDU fits
EDU’s college and university ERP is built around the idea that MIS reports shouldn’t require a separate reporting exercise at all — they should be a by-product of the modules staff already use every day.
- The admissions module feeds the admissions and enrollment report and the student demographic report directly from application and intake data, instead of a separate end-of-cycle count.
- The attendance module generates the attendance exception report automatically, flagging only the students who cross a defined threshold rather than exporting a full register for manual filtering.
- The fee module updates the fee collection and outstanding dues report in real time as payments are recorded, so accounts staff aren’t reconciling receipts against a spreadsheet at the end of the week.
- The examination module produces the examination-performance and backlog-and-progression reports as soon as results are processed, rather than after a manual re-tabulation.
- The faculty and timetable modules keep the faculty workload and timetable utilisation reports current as teaching assignments change through the semester.
- Evidence for the accreditation-evidence report is maintained continuously across modules, rather than assembled from scratch when a visit is scheduled.
Because these reports draw on the same underlying records, a management exception report can be configured to pull only the flagged items across all of them — giving registrars and directors a single weekly view without maintaining a parallel manual process. Institutions already using EDU for admissions, academics, or fee management can extend the same data into this reporting layer rather than starting a new spreadsheet system alongside it. For a broader look at how these pieces fit together, see our guide to college ERP software and our companion piece on parent portals for schools, which covers a related reporting need at the school level.
Conclusion
Most colleges and universities don’t need more data — they need their existing data organised into a small, well-owned set of reports that match the decisions leadership actually has to make. The 15 reports in this article, each with a clear owner and review frequency, give registrars and directors a starting checklist grounded in institutional data reporting rather than guesswork.
As Indian higher education moves further into digital transformation — with NAAC, NBA, and NIRF frameworks placing growing weight on evidence-backed governance — the institutions best positioned to respond won’t be the ones with the most dashboards, but the ones where MIS reporting is treated as everyday infrastructure. Getting the ownership, cadence, and structure of these 15 reports right today is what makes data-driven governance and continuous institutional improvement possible tomorrow, rather than a scramble each time a review or accreditation cycle arrives.
Frequently Asked Questions
What does MIS stand for in higher education?
MIS stands for Management Information System — the structured reporting layer that turns an institution’s operational data, such as admissions, attendance, fees, and examinations, into decision-ready summaries. In a management information system in higher education, each report has a defined owner, format, and audience, distinguishing it from raw data or a one-off spreadsheet extract.
How many MIS reports does a college or university actually need?
There is no fixed number, but most institutions cover their core academic, administrative, financial, and compliance needs with 12 to 15 well-defined college management reports, similar to the set covered in this article. Adding more reports beyond this rarely improves decision-making; it usually adds noise that leadership has to filter through manually instead.
Who should review MIS reports — the registrar, the director, or department heads?
Different reports suit different audiences. Operational reports like attendance exceptions are best owned by academic offices and HODs, while a consolidated management exception report is what a registrar or director should review, since an education MIS dashboard at that level should surface only the items requiring leadership attention, not every underlying data point.
How often should MIS reports in higher education be reviewed?
Frequency should match how quickly the underlying data changes and how costly a delay would be. Attendance and fee reports are best reviewed daily or weekly, faculty workload and placement reports monthly, and examination or accreditation-related institutional data reporting on a semester or annual cycle, in line with the academic calendar.
Can MIS reporting be automated in a college ERP?
Yes, provided the underlying data is consolidated in one system and definitions are standardised first. An integrated ERP can feed admissions, attendance, fee, and examination data directly into MIS reports, removing manual spreadsheet consolidation. Automating reports built on inconsistent or scattered data, however, will simply produce inaccurate numbers faster.